My second blog post! (woohoo!) I'm going to explain how my results scraper works. A very simple script that I built in 2 days. Why an entire post for this you say? Because this script holds a special place in my heart since it's the first ever project I ever attempted- and successfully completed.
The script works using Selenium , a portable framework for testing web applications which can be used to interact with HTML elements. If you look at my results page, it looks like this:
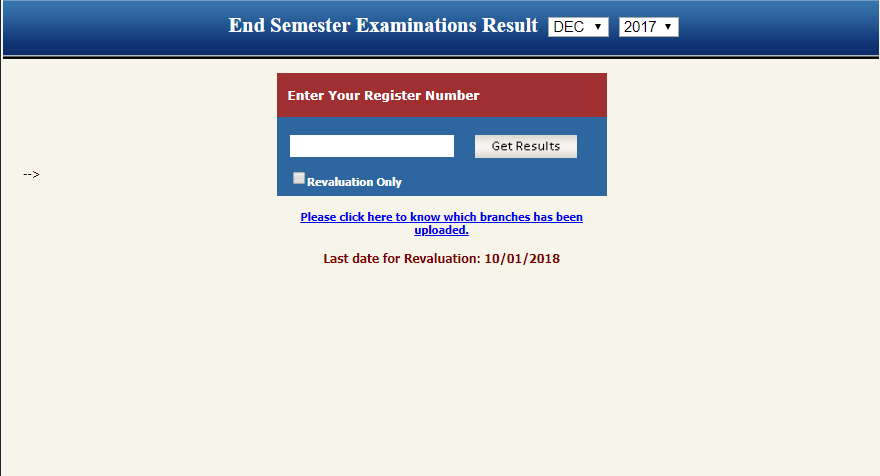
Pretty basic. An input element, a dropdown list, and an enter button. For the sake of simplicity (and just because I was lazy), I decided to not have any interaction with the dropdown list. Which means I could get the results of everyone who wrote just the most recent semester examination. Also, further down the line, I lost the need to implement this because.... sigh... I'll explain at the end.
So I get the IDs of the input box and button, which I used to paste a number into the the input box, and then I press enter.
So then we arrive at the following:
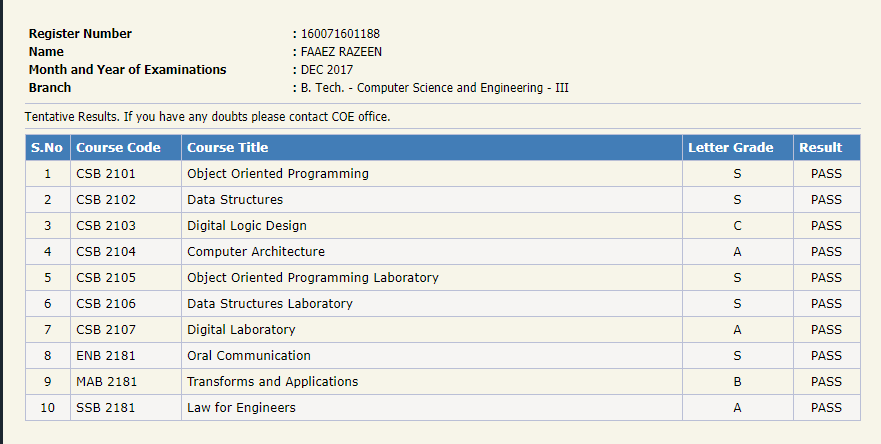
For whatever reason, some roll numbers don't exist, due to which my script initially failed. It took me half a day to come up with the solution, mainly because this was my first time working with Selenium and I had no clue about the intricacies of web scraping. Moreover, I possess the attention span of a goddamn goldfish. Moving on...
The data resides in HTML tables, so I get the info by scanning the page for the td tag. Since I get all data (I mean all) from the tables, I filter it out by enforcing two more conditions: if len(i.text) < 2 and i.text.isalpha():
So I take these grades, append them to the list, and input it to my GPA calculating function. The outcome is then again, a list, which co-exists along with 2 other lists, containing the student's name and roll number. List-ception!
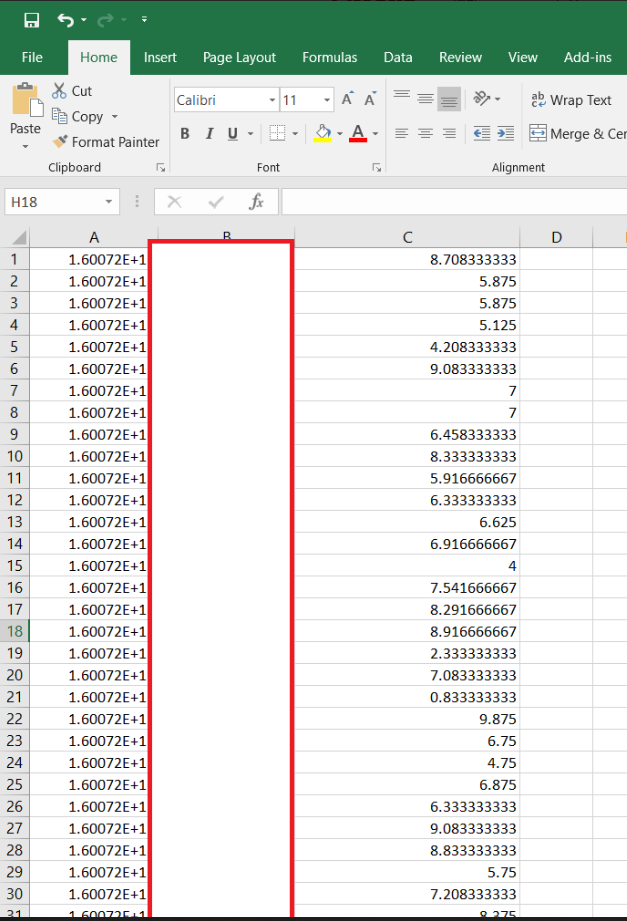
The script does this for each number, and it appends them one by one to a .csv file. Near the end of the script, I was getting frustrated, because I have this tendency to lose motivation quickly. So I just used our good ol' companion StackOverflow to get the code to write these lists to the .csv file. Finally, the outcome is this:
So. The gist of it is as follows:
- run a for loop through the roll number range
- input roll number into box, click the button
- get only the grades from the page
- do some magic and get the gpas
- write 'em to a .csv file
- boom
All in all, it takes a pretty long time to do everything, considering there's about 200 students. I had an itch at the back of mind, thinking to myself, "maybe I can make it faster if I use multithreading or some shit". Well it turns out my hunch was right, some dude pointed out in the comments of my Quora answer:

Maybe another day.
Uneventful Occurences
Now, in an unfathomable twist of events, my esteemed university decided to "upgrade" to a commercially outsourced learning platform, which means results aren't publicly available anymore. Students have to login to view their individual results privately. (The platform sucks by the way, it doesn't even show the GPA, forcing us to calculate it manually, it also scales awfully on mobile, 4 popups scream at my face everytime I login... I could go on but you get the point)
I'd like to thank my college for making stupid ass decisions, and also rendering my script useless within mere months of writing it.
Data Visualization using Seaborn
Currently, I'm learning about data visualization using Seaborn and I thought it'd be a good idea to implement some plots using the dataset that I just scraped.
I thought I could add the dropdown list to my script to get more info for my dataset, but sadly my university has taken down the website (as of Jan 22, 2019), so this will have to do.
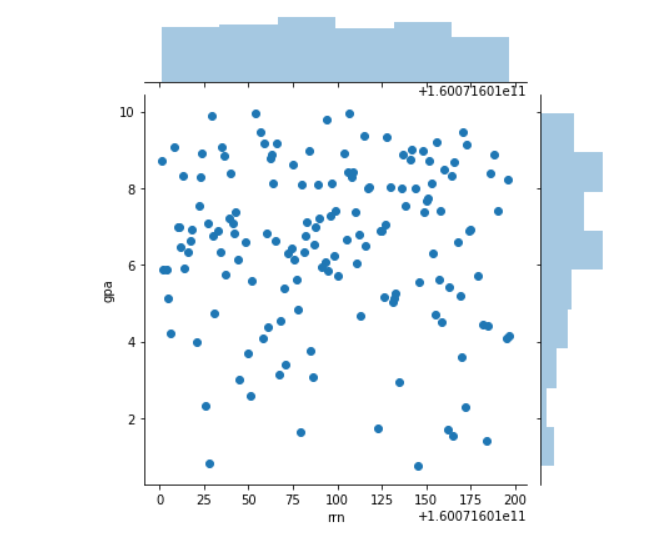
Nothing complicated, just wanted to try something out, so I drew a distribution plot of GPAs using Seaborn and I got the following output:
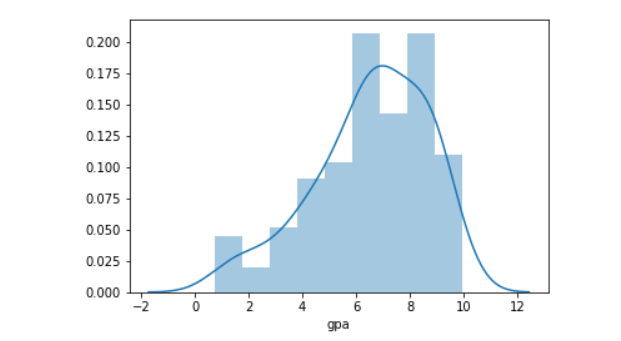
The mean GPA was 6.54. (higher than I expected, lol) I also wanted to see if there was any correlation between the roll number and the GPA using a scatter plot, and as you and I might have guessed, there wasn't.
Till we meet again,
FR.