Exploratory Data Analysis on IMDb Movies
- 11 min read
- Python
- Data Science
- Data Visualization
6 years ago
Sup. I'm back. And I've got something cool to show ya.
I've been working on a small data science project for the past few days, and I've just completed it.
After trying out various domains in the computer science field, I've finally come a decision that I'm most interested in domains such as data science, artificial intelligence, ML/DL. Although my skills in the latter 2 are almost non-existent, I decided to take what I know in data science and apply it in a small project to see how it goes.
What I built is a webscraper using BeautifulSoup4, which scrapes a list of Hollywood movies released from 2000-2018 and gets various information such as IMDb and Metacritic ratings, genres, gross profit etc. This is the first project that I've been truly interested in for a long time and I am glad I was able to complete it and gain some insights.
I think that's what I like about data science. Gaining insights on data which would otherwise be invisible. I was mainly interested in seeing how the IMDb scores and metascores varied, but the deeper I went in I found out I was also interested in things like which genre produced the most profit, and see whether normal distributions actually apply to real-world data. (This concept still fascinates me)
The Web Scraper
The hardest part. I went in with a barebones knowledge of bs4, and it proved to be a hard time extracting the data from the website. Even after extracting them, a lot of data cleaning had to be done before I could perform data analysis. This was the most difficult (and fun) part of the entire project, and I'm ashamed to say that looking back now, it doesn't seem that hard. Trivial, in fact. Maybe I just have a rapid knowledge consumption rate unlike all you plebs.

Just kidding.
I figured out that maybe I wasn't scraping data efficiently, as I had to do a lot of string manipulation to get the data I wanted. I mean, look at this:
meta_ratings.append(float(rating.text.split(" ")[0].split("\n")[1])/10) # don't even ask.
Maybe I've overcomplicated it due to lack of bs4 knowledge, but it works. And that's all the matters. For now.
movie_names = []
movie_years = []
imdb_ratings = []
meta_ratings = []
movie_earnings = []
movie_genres = []
runtimes = []
pages = 10  # 10 pages per year.
start_year = 2000
end_year = 2018
for i in tqdm_notebook(range(start_year, end_year+1), total = end_year-start_year, unit = 'year'):
  k = 1
  for j in range(1, pages + 1):
    imdb_url = 'https://www.imdb.com/search/title?release_date=' + str(i) + '-01-01,' + str(i) + '-12-31&sort=num_votes,desc&start=' + str(k) + '&ref_=adv_nxt'
    page_unparsed = urllib.request.urlopen(imdb_url)
    page_parsed = BeautifulSoup(page_unparsed, 'html.parser')
    k += 50
    movie_divs = page_parsed.find_all('div', class_ = 'lister-item mode-advanced')
    for movie in movie_divs:
      skip_movie = False
      meta_rating_unparsed = movie.find('div', class_ = 'inline-block ratings-metascore')
      gross_unparsed = movie.find_all('span', attrs = {'name' : 'nv'})
      if meta_rating_unparsed is None or gross_unparsed is None:
        continue
      temp = movie.find_all('span', attrs = {'name' : 'nv'})
      if len(temp) is not 2:
        continue
      else:
        movie_earnings.append(float(temp[1].string.strip('$').strip('M')))
      meta_ratings.append(int(meta_rating_unparsed.text.replace(" ", "").split("\n")[1]))
      movie_genres.append(movie.find('span', attrs = {'class' : 'genre'}).text.strip().split(",")[0])
      imdb_ratings.append(float(movie.find('div', class_ = 'inline-block ratings-imdb-rating').text))
      movie_names.append(movie.find('h3', class_ = 'lister-item-header').find('a').text)
      year = movie.find('span', class_ = 'lister-item-year text-muted unbold').text.split(" ")
      if len(year) == 1:
        movie_years.append(year[0][1:5])
      else:
        movie_years.append(year[1][1:5])
      runtimes.append(int(movie.find('span', class_ = 'runtime').text.strip('min')))
Insights & Data Visualization
There is an inherent flaw in my dataset. Each movie had multiple genres, but I took only the first genre listed. I do not know how to incorporate multiple genres into this project. And for that reason, all findings related to genre might be wrong. A sad thing to say the least, but I carried on with it as I was too invested.
Rating Metric
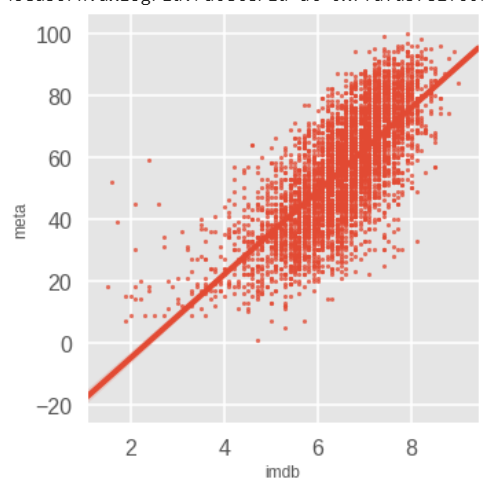
I used Seaborn, because it's Seaborn. The first thing I wanted to see was if IMDb ratings and metacritic ratings have any correlation with each other. The scoring metric (taken from their respective websites) for each are as follows:
IMDb
We take all the individual ratings cast by IMDb registered users and use them to calculate a single rating. We don't use the arithmetic mean (i.e. the sum of all votes divided by the number of votes), instead the rating displayed on a title's page is a weighted average.
Interesting. The reason for them using a weighted average is to enforce the concept of Wisdom of the crowd .
Metacritic
While we solicit votes from our site visitors on movies, games, and music, and television shows we do not include those votes in the METASCORE. The METASCORE is a weighted average of the published critic reviews contained in the chart on that page, and thus does not include any votes or comments from our users.
Interesting! While IMDb is wholely dependent on the individual users, Metacritic uses scores from public critic reviews. Looking at the scoring metric for both of these, I can guess that correlation between them will be positive, as the people rating them are in fact, humans.
As evident by the KDE plot below, IMDb and Meta ratings have the same opinions on movies with a ratings of 6 - 6.5 (or 60 - 65). With both these graphs, we can make our first inference:

Inference 1: People and critics tend to have the same view on movies. Both have the same opinions one movies with a rating of 6 (or 60).
This distribution plot for each metric is shown below. I'm guessing this is because meta ratings are done by critics, who take a lot into account and is kinda their job to do this sort of stuff. So their ratings are gonna vary a bit. That's why the distribution mirrors a normal distribution. Meanwhile, IMDb ratings are done by us, normal folk. If we like a movie, we give it a high rating, and we tend to do so a lot.
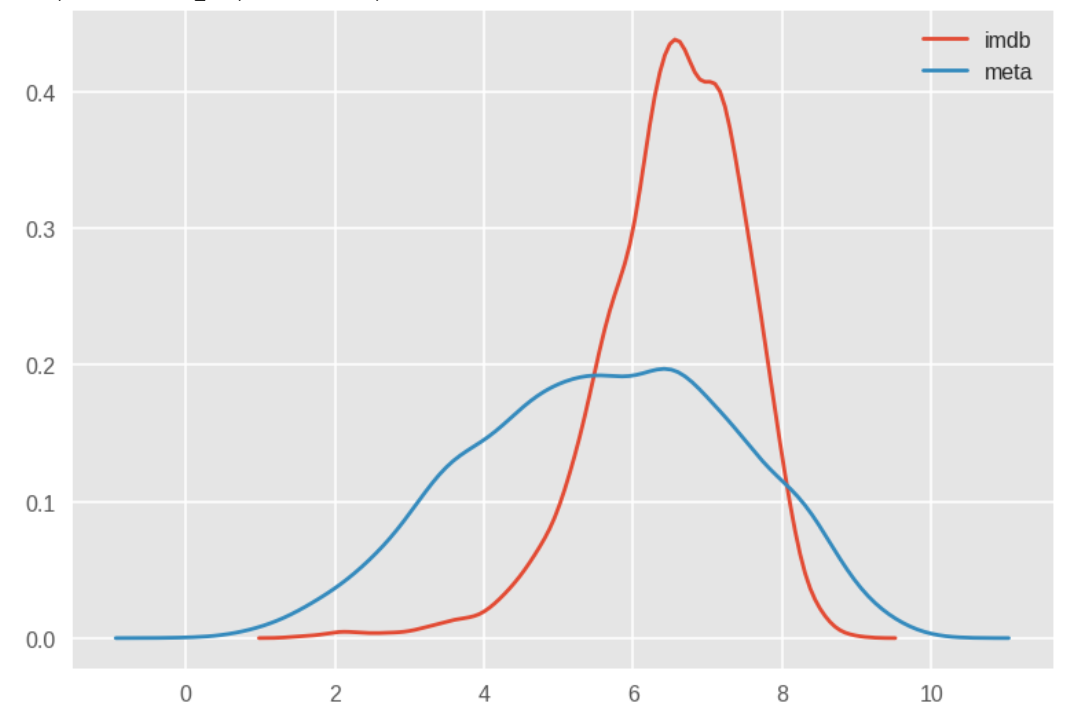
Inference 2: Meta ratings follow a normal distribution while IMDb ratings tend to favour the 5 - 8 range.
Violin plots for rating distributions for each genre didn't give much info, other than the fact that biography movies tend to get high ratings. For 7 genres, the number of movies were 10 or below, so I'm not going to take them into account. These 7 genres cause their respective violin plots to look a little weird.
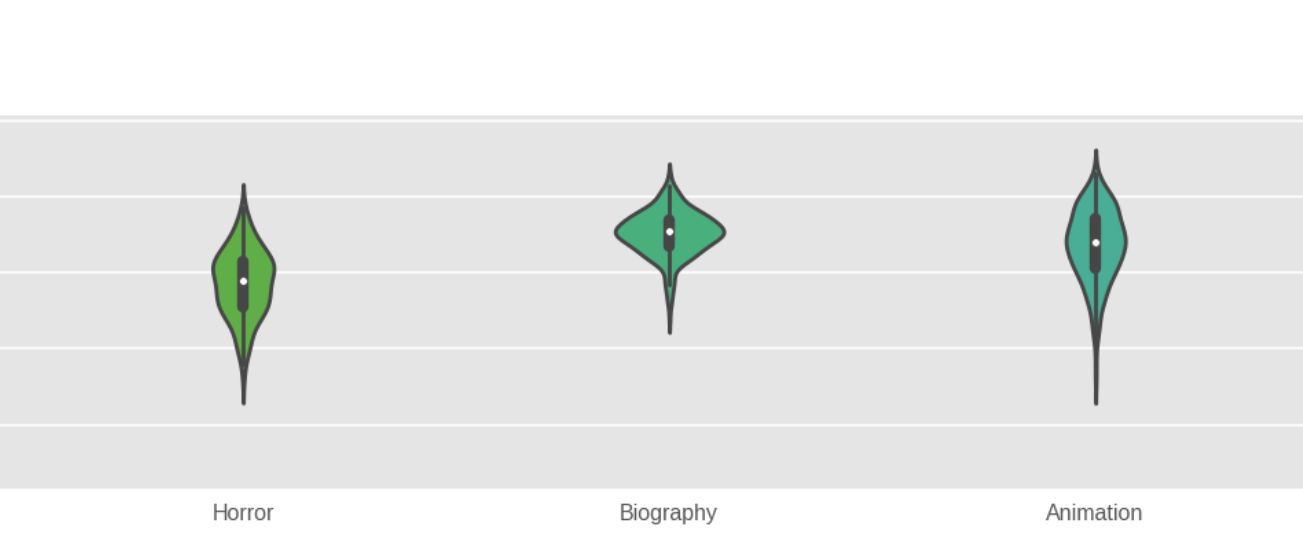
Inference 3: Biography movies tend to have high ratings.
Boxplots show us an interesting thing. This dataset has a lot of outliers. I don't know if it is due to the fact that the dataset is massive, or the inherent unpredictability of movies.
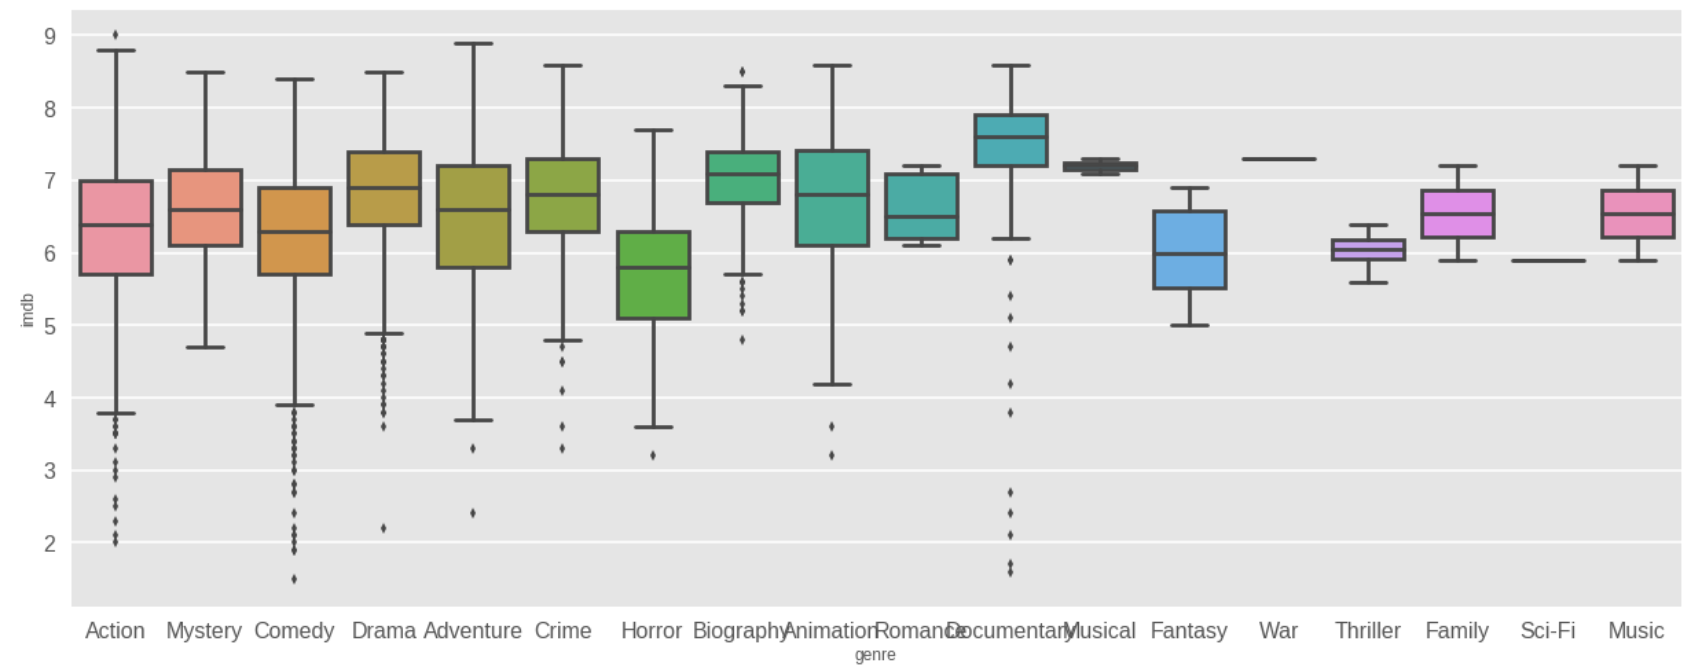
Inference 4: In the world of movies, there tend to be a lot of outliers.
Here are the lowest and highest rated movies of each rating metric:
IMDB
- Highest rated: The Dark Knight (2008). Score: 9
- Lowest rated: Saving Christmas (2014). Score: 1.5
Meta
- Highest rated: Boyhood(2014). Score: 100
- Lowest rated: Death of a Nation(2018). Score: 1
Gross
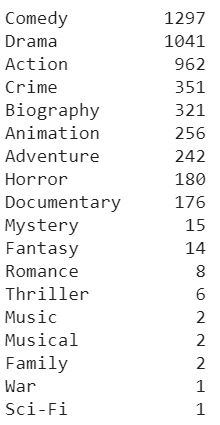
Each movie had anywhere from 1 to 3 genres. To simplify the process, I figured the first genre for each movie would be most accurate. Looking at the dataset, only the first 9 genres are the most abundant.
First thing I wanted to see was if there was any correlation between the IMDb score and box office. There wasn't. Same can be inferred for meta ratings, as they are positively correlated.
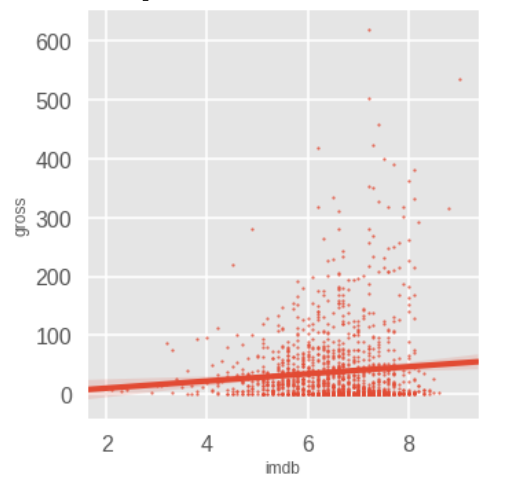
Inference 5: No correlation between IMDb or meta scores and movie box office.
Next, I wanted to check out the mean gross for each genre. Barplot would be perfect for this.
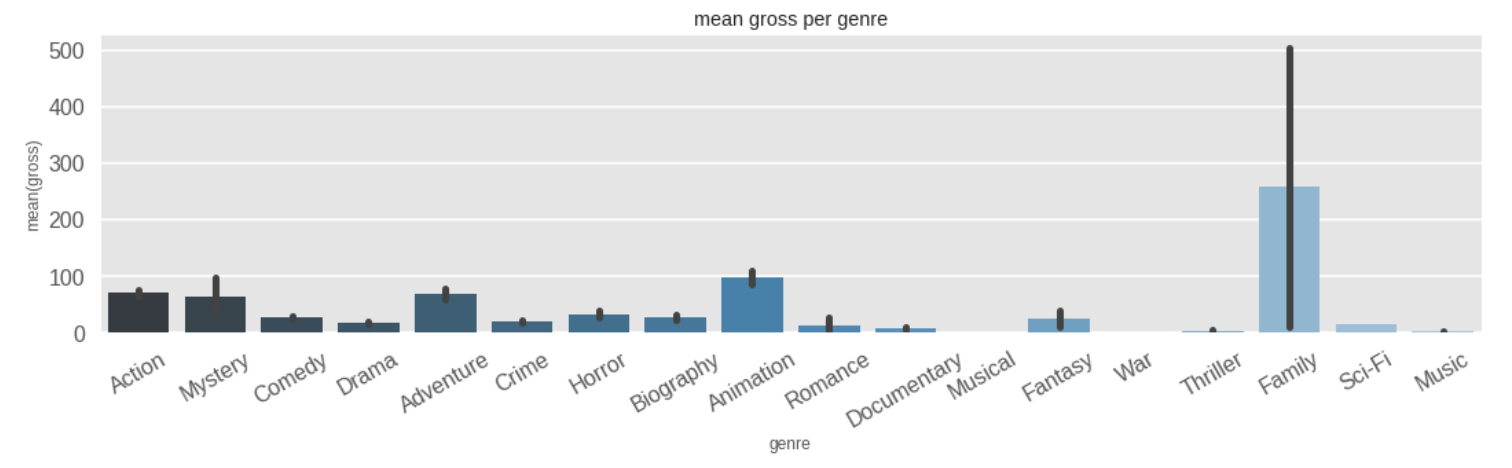
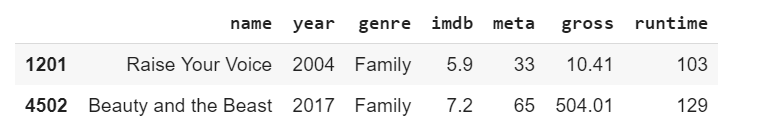
Hmmm. Notice the big black line for the Family genre? It indicates that there is a high chance of it being erroneous. It's called an error bar. The reason for this is the fact that there are only 2 movies in the Family genre, and one of them was Beauty and the Beast, which earned a whopping $504 million box office. That's a lot.
I wanted to see how much profit Family movies made per minute. It turned out to 2.2 million per minute of screentime!. Family movies are the most profitable, followed by Animation and Action.
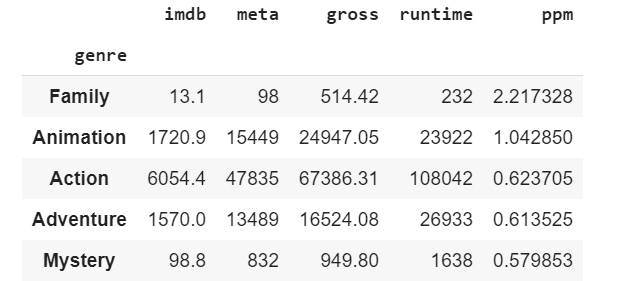
Inference 6: Family movies had the best profit per movie value.
Inference 7: The most profitable movie genres are Family, Animation, and Action.
The sum of gross for each movie show that Action movies made the most money.
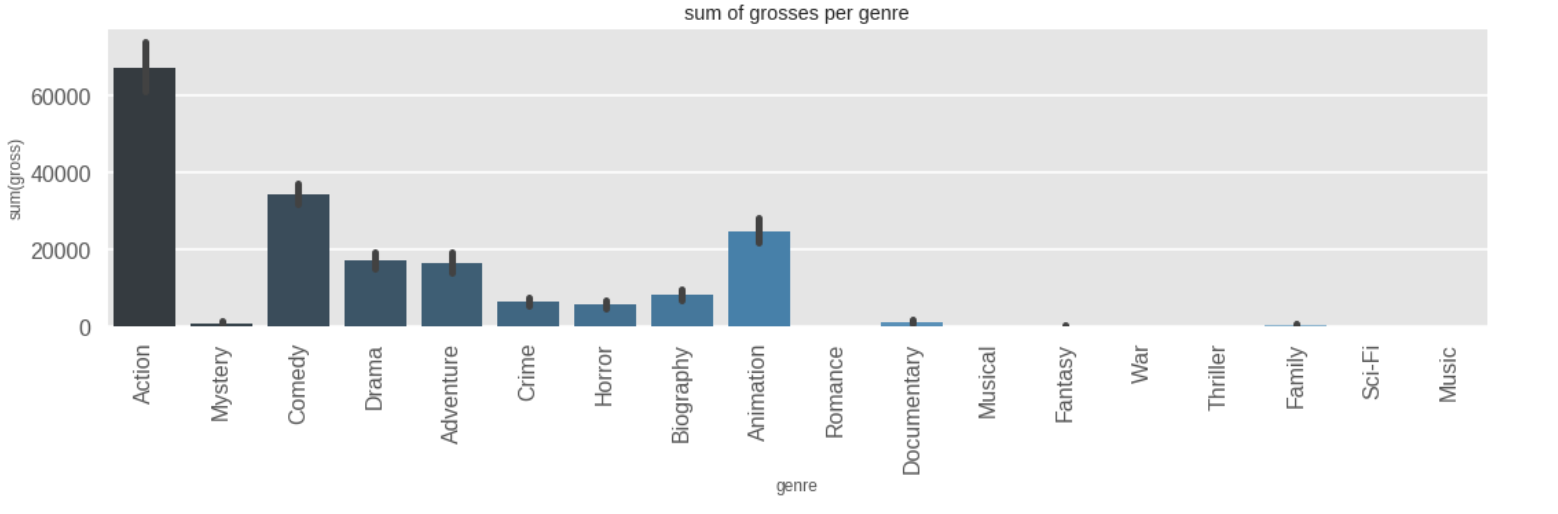
Inference 8: Action movies had the most profits (67k million), followed by comedy movies (34k million) and then animation movies (25k million).
Genre
The barplot of the count of each movie shows that Comedy movies were the most frequent.
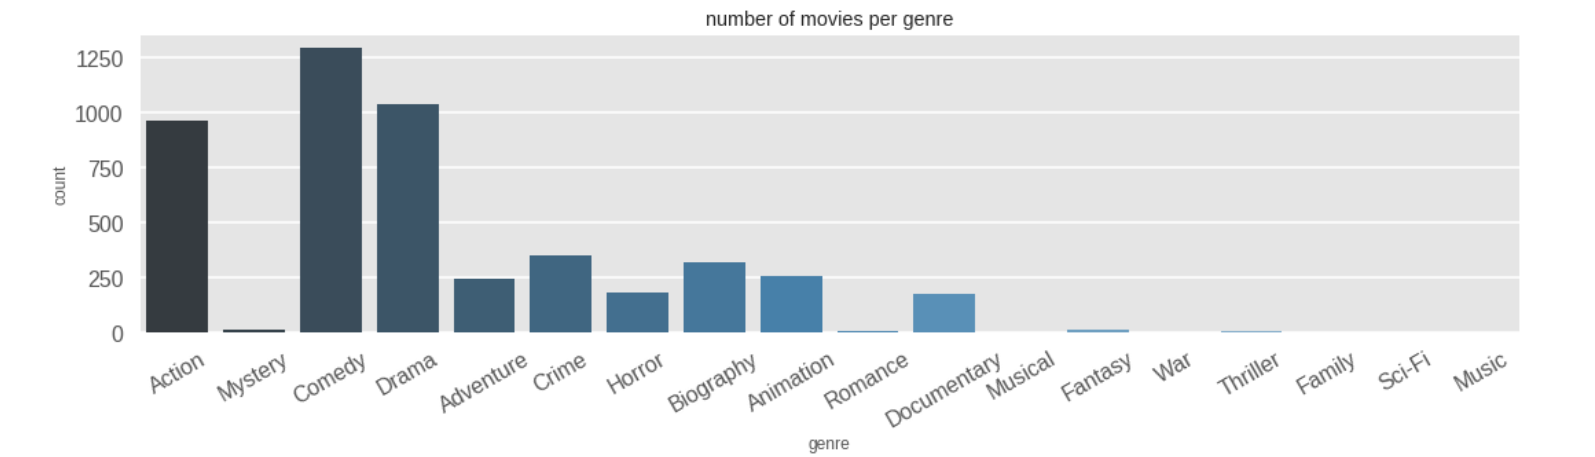
Inference 9: Comedy movies were the most frequently released, followed by drama and action movies.
The average rating per genre doesn't seem to change much for IMDb. This follows up with my finding that IMDb ratings tend to favor the 6-8 range, and this is evident by the barplot below.
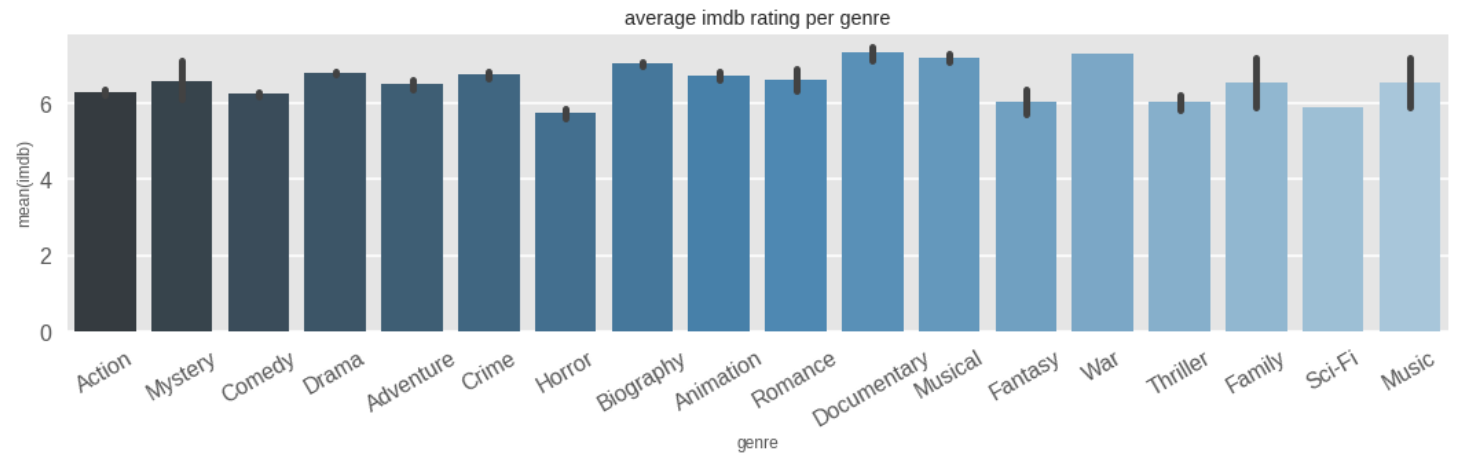
Inference 10: For IMDb ratings, on average, horror movies got the lowest ratings while war, documentary, and musical movies seem to get the highest.
Inference 11: IMDb movies tend to approximately get the same ratings regardless of genre.
Meanwhile, for meta ratings, the average rating per genre tend to be more varied than the IMDb ratings.
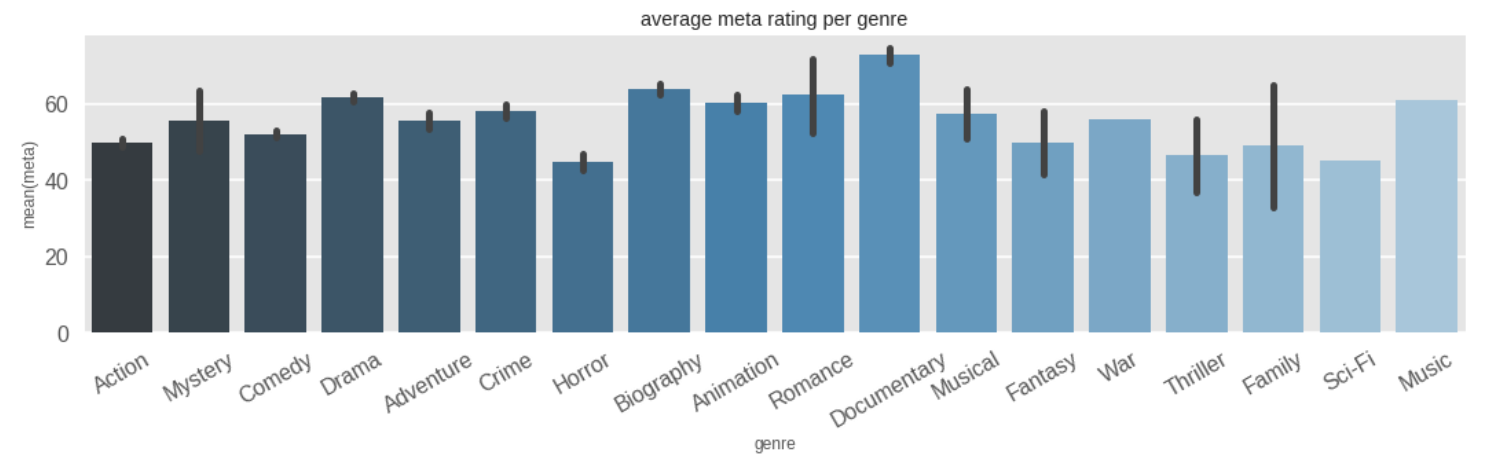
Inference 12: For meta ratings, documentary movies get the highest average rating, while Sci-Fi and Horror get the lowest.
Inference 13: Mean ratings for each genre for metacritic tend to vary for each genre, unlike IMDb ratings.
From Inferences 10 and 12, we can derive another inference:
Inference 14: Horror movies are the most disliked, Documentary movies are the most liked.
Runtime
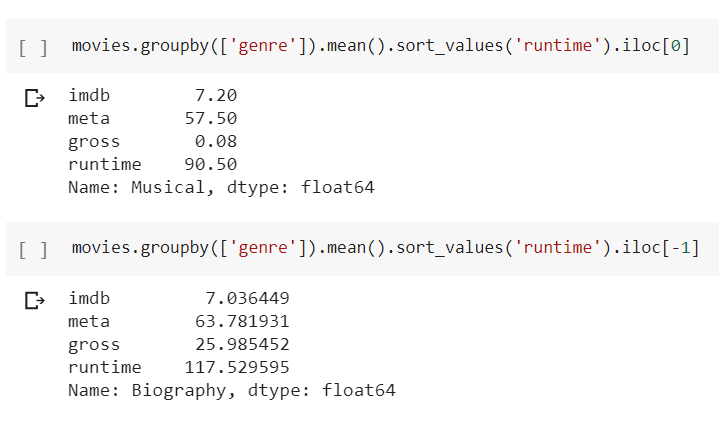
Inference 15: Biography movies had the longest average duration. (117 mins). Musical movies had the lowest. (90 minutes)
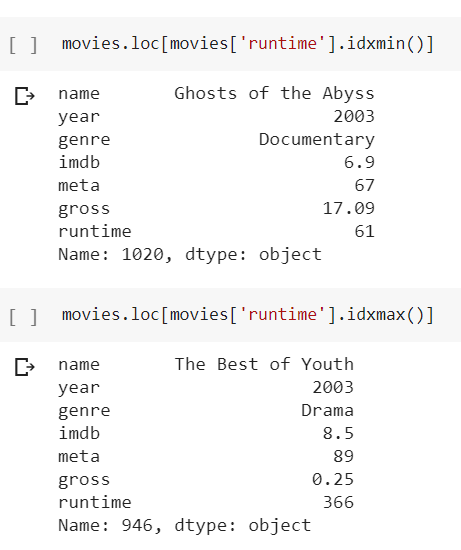
Inference 16: Longest movie was 'The Best of Youth', which ran for 366 minutes (6 hours). Shortest movie was 'Ghost of the Abyss', which ran for 61 minutes. (1 hour)
The scatter plot for runtime against gross shows that they are slightly correlated.
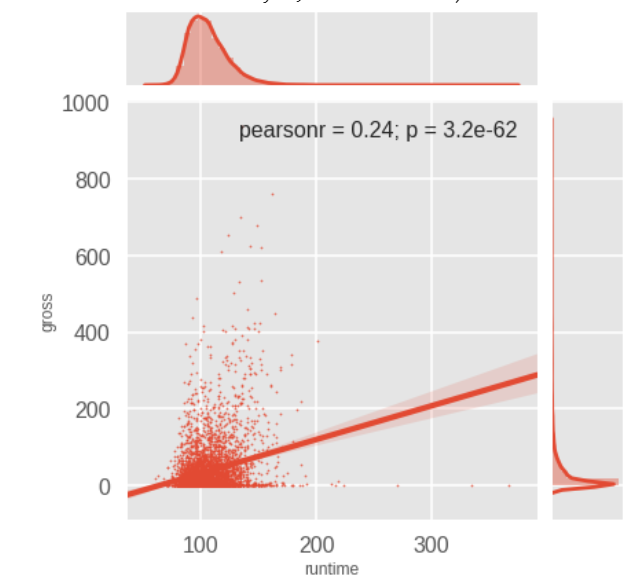
Inference 17: Runtime and box office are slightly correlated. Meaning, if the duration of a movie is more, it earns more.
Year
Boxplot of mean box office per year shows that the gross has increased as the years progressed. Maybe this is because more people are starting to watch movies or spend more on movies than before. Also notice the error bars. They seem to be pretty high here.
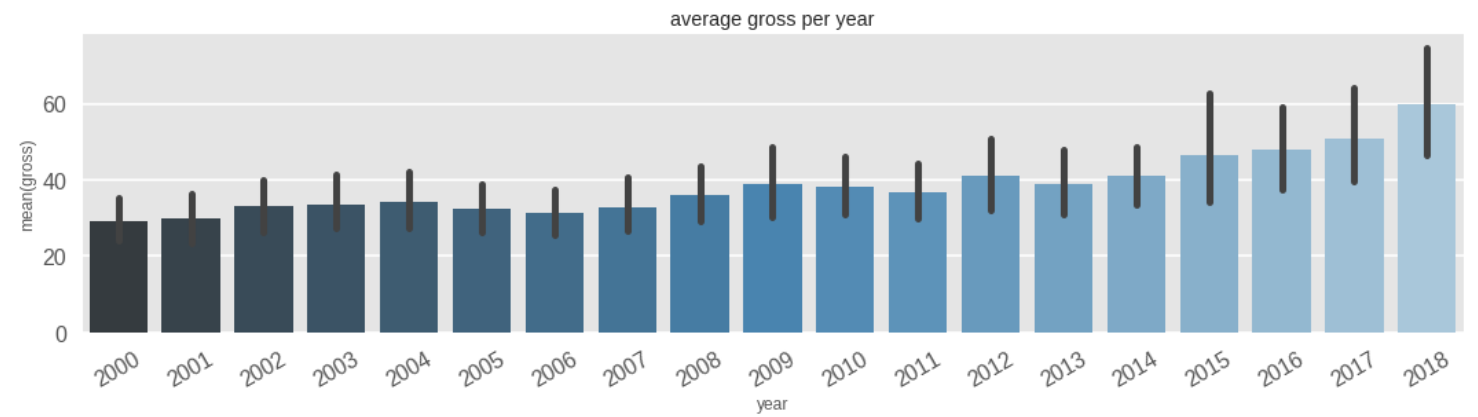
Inference 18: Average earning for movies increased as time went on.
The bar plot of count of movies per year show that as years went on, the number of movies released per year decreases. I cannot fathom why. Maybe people got tired of updating the IMDb list. Probably. I hope.
Inference 19: Number of movies released per year decreased.
Summary
The following list encompasses all my findings as brief as possible.
- IMDb ratings tend to favour the 5 - 8 range
- Critic ratings follow a typical normal distribution.
- IMDb ratings and critic ratings are not correlated, therefore they do not judge on a similar basis.
- Family movies are the most profitable on average.
- Action movies had the highest profits (by summation, not average).
- A large amount of movies released belongs to the following genres: Comedy, Action and Drama.
- People tend to give generalized ratings regardless of genre.
- Critics tend to base their ratings to genre.
- Documentary movies are the most liked, while Horror movies are the most disliked.
- Biography movies ran the longest while Musical movies were the shortest.
- Movie runtimes ranged from 61 mins to 366 mins.
- Runtime and box office are positively correlated.
- As the years progressed, movies earned more.
- As the years progressed, overall number of released movies declined.
I'm done.
Phew. Another project completed. I had such high energy when doing the project itself but writing this blog post was a drag. I don't like to hold onto things for long. I'm glad I've finally done with it. It was a learning experience for sure.
The thing that's bugging me is the inherent flaw in my dataset, which I've mentioned above. This may cause all the findings related to genres to be false. That's a bummer. I don't know a workaround for this. Well, it's finally done.