Using the Foursquare API to analyze Chennai's neighborhoods
- 10 min read
- API
- Python
- Data Visualization
6 years ago
As part of a course I'm doing on Coursera, I am supposed to write a blog post for my final project. What better platform to do that other than your own website?
The certification course is called the IBM Data Science Professional Certification. While it is a great starter course, I found it to be to great in width and very low in depth. I would recommend it to most who have no knowledge of data science.
Anyway, here's the content.
The Project
The final capstone project is called 'Battle of the Neighborhoods'. Here's what the instructions say:
Now that you have been equipped with the skills and the tools to use location data to explore a geographical location, over the course of two weeks, you will have the opportunity to be as creative as you want and come up with an idea to leverage the Foursquare location data to explore or compare neighborhoods or cities of your choice or to come up with a problem that you can use the Foursquare location data to solve.
I am supposed to use the Foursquare API (a location based service), in order to get location data and use it to compare different neighborhoods and use it to solve a problem. I came up with a very trivial problem since I was short on time (since Coursera works on a monthly subsription basis and I didn't want to pay any more). However in the future I will come up with an actual problem that needs to be solved.
The (Fake) Preamble
Mr. Nolan is going to be moving in to the city of Chennai, located at the south edge of the Indian subcontinent. He needs to find suitable housing. However, he frets. He doesn't worry about the locality one bit; except the fulfillment of one condition: there needs to be a lot of restaurants/food stalls nearby. You see, Mr. Nolan is a foodie. Not a day goes by where he does not make or savour a new dish. He has come to me for help, asking me to analyze the different areas in the city of Chennai and find which neighborhoods would be the best for a foodie like him to move in to. Me, being the perfect philanthropist as I am, have decided to help Mr. Nolan using a bit of data and a bit of science.
Introduction
The aim here is to find neighborhoods with a high frequency of restaurants/food stalls/cafés. Firstly, the number of neighborhoods and their respective coordinates need to be retrieved, so that Foursquare can find nearby venues. The preferred method is using the geopy package but for some reason, it did not work here. So I used urllib and bs4 to get the coordinates. Using this data, Foursquare should be used to search for nearby venues and get their categories.
These venues are then clustered using k-means. The cluster in which eateries are of the highest frequency will be the set of neighborhoods we are looking for. All of these neighborhoods would be suitable for Mr.Nolan to move in. This problem can also be easily extended to fit other requests, such as finding the neighborhoods with low real estate prices, neighborhoods with a wide variety of grocery shops, neighborhoods closest to public transportation systems, etcetera.
The target audience here is people who are moving to a new city and require some knowledge about the neighborhoods beforehand so that they can decide the place they want to live in.
Data
Wikipedia Scraper
Since available data for Chennai city was sparse online, I've manually scraped the list of neighborhoods from this Wikipedia page using bs4, and then grabbed all the hyperlinks. Using urllib, these links are visited individually and the coordinates and pincodes are scraped and put into a pandas dataframe.
This is what my dataframe looks like:
| Name | Latitude | Longitude | |
|---|---|---|---|
| 0 | Adambakkam | 12.99 | 80.2 |
| 1 | Adyar | 13.0063 | 80.2574 |
| 2 | Alandur | 13.003 | 80.204 |
| 3 | Alapakkam | 13.049 | 80.1673 |
| 4 | Alwarpet | 13.0339 | 80.2486 |
Foursquare
The next step is to get all the venues in each neighborhood within a specified radius, in this case, 500 metres. To use Foursquare, we need to create an account as they offer a limited number of API calls per day for a free user (more if you give your credit card details). After signing up, we will get a CLIENT_ID and a CLIENT_SECRET which are then appended to a URL along with other parameters, which is then used to send a GET request to that URL. The resulting JSON file is then parsed and stored for further use.
After doing this for each neighborhood, the resulting venues are again put into a pandas dataframe.
| Neighborhood | Neighborhood Latitude | Neighborhood Longitude | Venue | Venue ID | Venue Latitude | Venue Longitude | Venue Category | |
|---|---|---|---|---|---|---|---|---|
| 0 | Adambakkam | 12.99 | 80.2 | Pizza Republic | 4bf58dd8d48988d1ca941735 | 12.991 | 80.1986 | Pizza Place |
| 1 | Adambakkam | 12.99 | 80.2 | Loiee | 4bf58dd8d48988d16a941735 | 12.9922 | 80.199 | Bakery |
| 2 | Adambakkam | 12.99 | 80.2 | Thalapakattu Hotel | 4bf58dd8d48988d142941735 | 12.992 | 80.1989 | Asian Restaurant |
| 3 | Adambakkam | 12.99 | 80.2 | The Great Kabab Factory | 5283c7b4e4b094cb91ec88d7 | 12.9938 | 80.2017 | Kebab Restaurant |
| 4 | Adyar | 13.0063 | 80.2574 | Bombay Brassiere | 54135bf5e4b08f3d2429dfdd | 13.007 | 80.2564 | North Indian Restaurant |
Methodology
After this, the venue categories are one-hot encoded and then the 10 most frequent venues (only five shown here) in each neighborhood are found using code that I totally did not copy-paste from the tutorial notebooks. The result is this:
| Neighborhood | 1st Most Common Venue | 2nd Most Common Venue | 3rd Most Common Venue | 4th Most Common Venue | 5th Most Common Venue | |
|---|---|---|---|---|---|---|
| 0 | Adambakkam | Pizza Place | Bakery | Kebab Restaurant | Asian Restaurant | Women's Store |
| 1 | Adyar | Indian Restaurant | North Indian Restaurant | Vegetarian / Vegan Restaurant | Electronics Store | Juice Bar |
| 2 | Alandur | Hotel | Fish Market | South Indian Restaurant | Movie Theater | Donut Shop |
| 3 | Alapakkam | Indian Restaurant | Fast Food Restaurant | Women's Store | Donut Shop | Flea Market |
| 4 | Alwarpet | Indian Restaurant | Lounge | Hotel | Japanese Restaurant | Restaurant |
After this, k-means clustering is used to group these neighborhoods. I forgot to choose the best k for this algorithm. I didn't notice until after I published this. Oh well. After they are clustered, we can use Folium (which is a map visualization library for Python), to see all the neighborhoods and the cluster they belong to on a nice map:
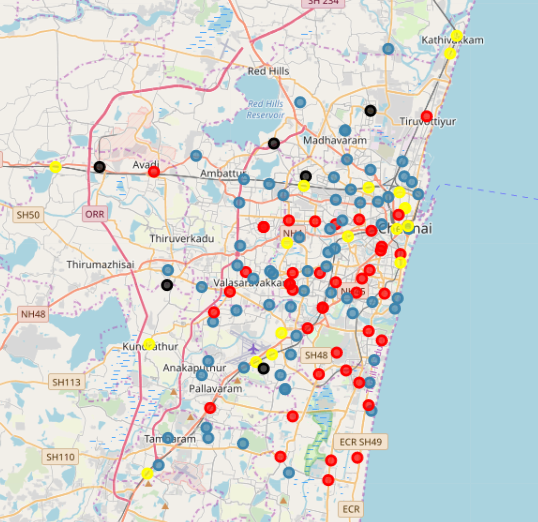
Not much can be inferred from this map. Due to the fact that the clusters are grouped together not due to their Euclidean distances on the map, but due to properties of the venues themselves. Inspecting the dataframe which has the cluster labels along with the most frequent venue in each neighborhood, we can see that:
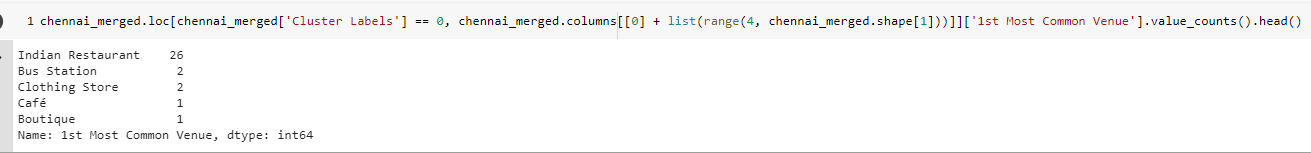
- Cluster 0 (Red) have Indian Restaurants as their most frequent venue.
-
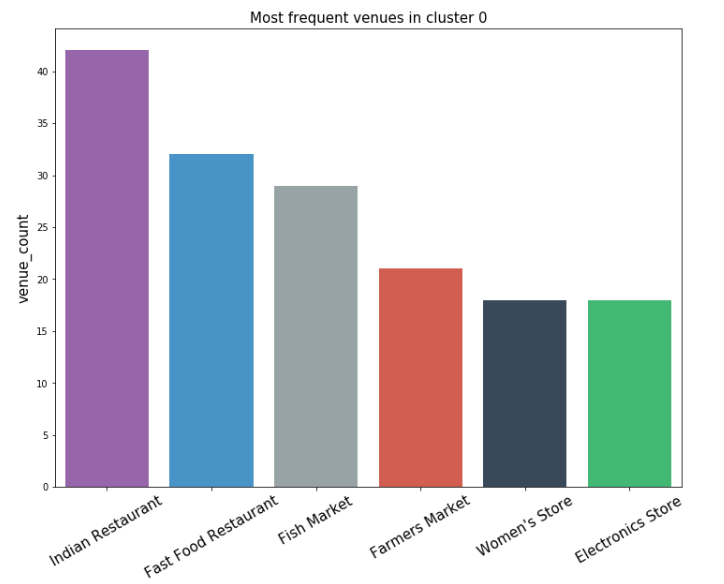
Cluster 1 (Blue)'s frequent venues are mostly related to food. Evident by counting the occurences of each.
-
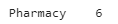
Cluster 2 (Black) has pharmacies as the most frequent venues.
-
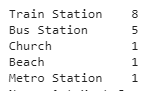
Cluster 3 (Yellow) has multiple forms of transport as the most frequent venues.
Use these results, we can solve our trivial problem. Nolan should move to neighborhoods in either Cluster 0 or Cluster 1, as they have a high concentration of restaurants and other food-related venues.
Results
While it looks like we have solved our problem, there is one flaw. Clusters 1 and 2 (Red and Blue) are grouped sporadically, in such a way that Nolan would not have a problem finding food in the majority of the city. Of course, Foursquare data for the city of Chennai is considerably sparse compared to other well developed cities. It also probably does not take into factor the ton of small food shops scattered throughout the city. Using Foursquare, the individual ratings for each venue could also be retrieved, but it did not seem to have rating data for Chennai. This would've helped pick out individual restaurant suggestions and give Nolan a neighborhood with highly rated restaurants.
Conclusion
Mr. Nolan would not have trouble finding food in the city of Chennai. For lesser travel times, he can choose any of the neighborhoods in Cluster 0, however he'll find that most of them are Indian restaurants. Independent of travel distance, the cluster choice does not matter much as there are more restaurants than any other venue. There is simply not enough data to do an in-depth analysis. However, individually marking the venues which are food-related is also a possibility- something to do for the future.
The outcome of the project was impacted by the limited effectiveness of the Foursquare API for a city like Chennai. Using some other more developed city would've probably yielded better results. The way the neighborhoods were suggested were majorly due to Indian restaurants alone.
Further analysis could've been done by using the rating of each venue however yet again ratings were not available for venues in Chennai. If ratings were available, individual restaurants in each locality could've been suggested.
Final Thoughts
I am in no way entirely happy with the content I posted. It's just too simple. There is so much more that could be done but for now this shall suffice. I will probably get back to this in the future. Probably.
From the stars,
FR.